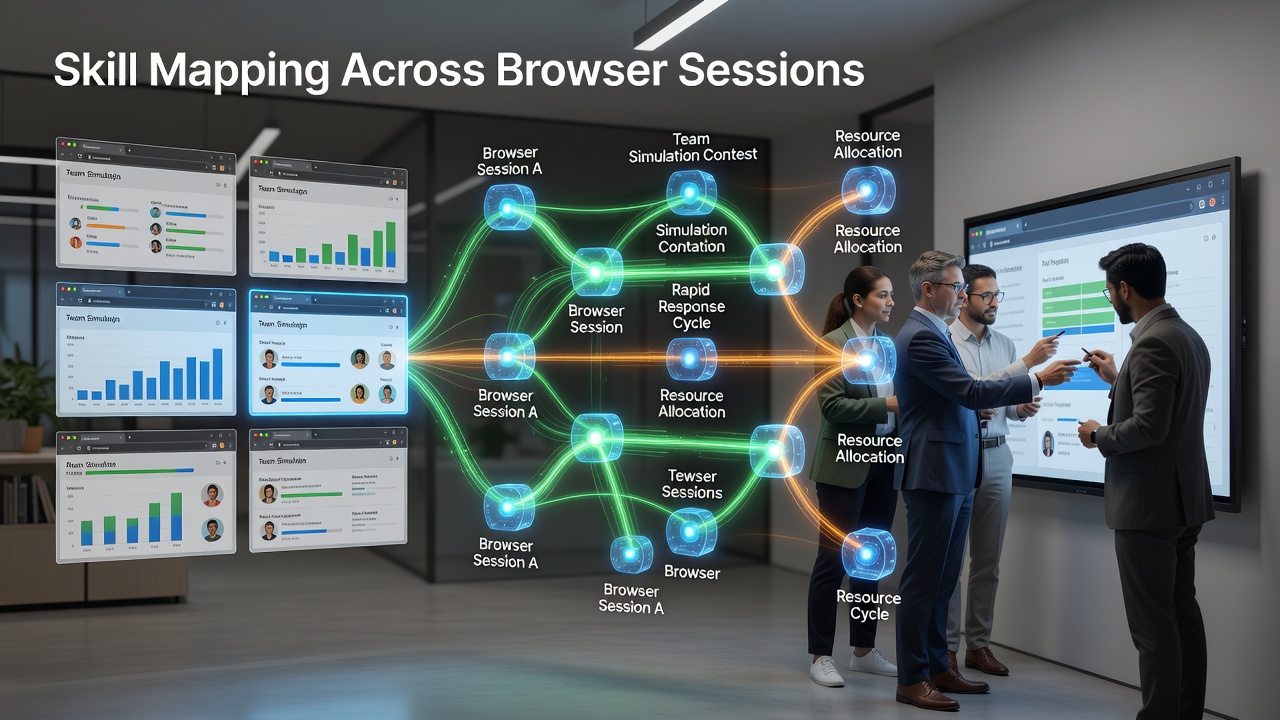
Skill Mapping Across Browser Sessions in Team Simulation Contests
Skill mapping tracks individual and group competencies as they develop across separate browser sessions in team simulation contests. These contests combine rapid response requirements with decisions about how to distribute limited resources among participants who connect through standard web browsers. Data from multiple sessions allow observers to chart how reflexes and planning intersect when teams face timed challenges that simulate real operational environments.
Browser Session Continuity and Data Tracking
Modern web technologies enable persistent tracking of user actions without requiring dedicated software installations. Session identifiers stored in browser storage systems record sequences of clicks, timing between inputs, and choices made under pressure. Researchers have documented how these records accumulate across days or weeks when participants return to the same contest platform using different devices or network conditions. Patterns emerge when analysts compare response speeds during early sessions against later ones where resource constraints tighten. Studies indicate that such continuity reveals shifts in how teams prioritize tasks once they recognize recurring elements in the simulation scenarios.
Resource allocation mechanics require teams to assign points or units to different roles while maintaining enough reserves for unexpected events. Browser interfaces present these choices through visual dashboards that update in real time. When rapid response cycles occur simultaneously with allocation decisions, participants must weigh immediate actions against longer-term needs. Figures from platform logs show that teams maintaining balanced distributions across sessions achieve higher completion rates in subsequent rounds.
Intersection of Response Speed and Allocation Strategies
Contests often place participants in scenarios where a single delayed reaction consumes extra resources that could have supported other team members. Observers note that successful groups develop internal signals to flag when one member should cede control to another with faster current reaction times. This coordination appears in chat logs and action timestamps collected during sessions. Data collected in 2025 and projected forward into June 2026 events suggest that platforms are adding more granular metrics for measuring how quickly allocation adjustments occur after a rapid event.
Simulation frameworks built on WebGL and WebRTC allow multiple users to view synchronized states without latency spikes that break immersion. When a resource pool shrinks because of an incorrect allocation, teams that recover fastest demonstrate measurable improvements in later browser sessions. Analysts compare these recovery intervals against baseline performance recorded in the first session of a contest series. The resulting maps highlight which individuals consistently contribute to recovery phases versus those who excel only during initial setup stages.
Mapping Techniques Used by Analysts
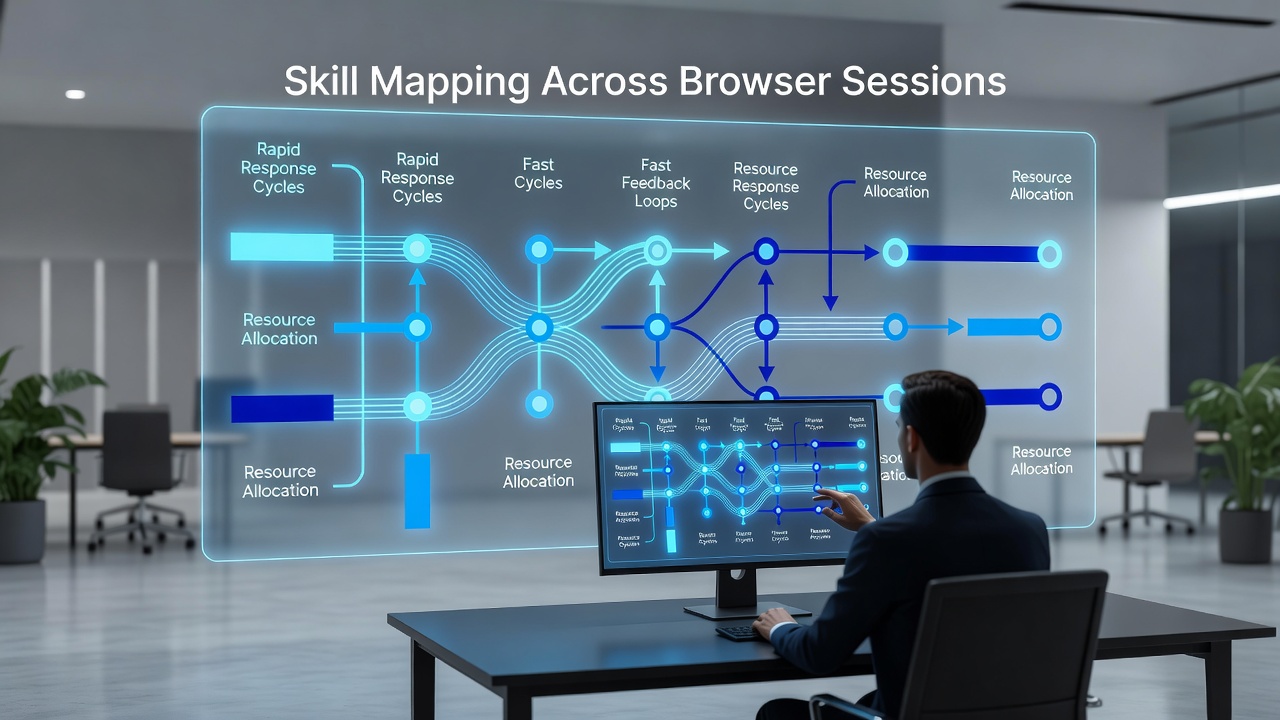
Analysts apply sequence mining to logs that capture every input timestamp and resource change. These methods identify clusters of actions that repeat across sessions even when the visual presentation of the contest changes slightly. One documented approach involves overlaying response latency heatmaps onto allocation flow diagrams so that high-pressure moments become visible as concentrated nodes. Teams whose maps show fewer such nodes after several sessions demonstrate clearer division of labor.
Additional layers of mapping incorporate external variables such as connection quality and device type. Reports from European simulation training programs indicate that accounting for these variables prevents misattribution of slow responses to skill deficits when network conditions are actually responsible. In June 2026, several contest organizers plan to release updated dashboards that automatically flag sessions conducted under variable latency so analysts can adjust their interpretations accordingly.
Examples from Recent Contest Series
Take one series hosted on a university platform where engineering students competed in supply-chain simulations. Logs revealed that teams allocating reserves early in the session maintained steadier response times during later rapid cycles. Another series organized by an industry consortium in Australia tracked medical triage simulations. Participants who rotated allocation responsibilities across sessions showed more consistent performance when measured by both speed and accuracy metrics. These cases illustrate how mapping data can inform adjustments to team composition before the next round begins.
Platforms have begun integrating machine learning models that predict which skill combinations will produce stable performance under varying resource loads. Training data for these models come from aggregated session records stripped of personal identifiers. According to findings presented at a 2025 digital skills conference, models trained on browser-based contest data achieve higher predictive accuracy when they include both response timing and allocation history rather than either factor alone.
Conclusion
Skill mapping across browser sessions provides structured visibility into how rapid response cycles and resource allocation interact within team simulation contests. Continued collection of session data through standard web technologies supports ongoing refinement of these maps. As contest platforms incorporate additional metrics ahead of June 2026 events, analysts gain clearer pictures of which team configurations sustain performance across multiple rounds and changing conditions.